
Work / Marketing Campaign Analysis
MARKETING CAMPAIGN ANALYSIS
10,000 campaigns across five channels, compared on funnel and ROAS

10,000 campaigns across five channels, compared on funnel and return.
The question
Which channels actually return the most, and where does the funnel lose people?
The result
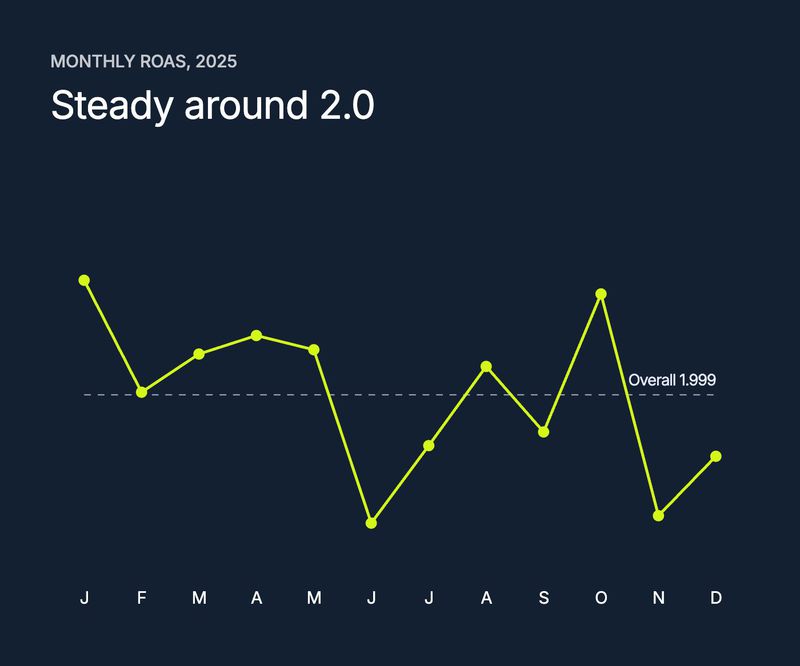
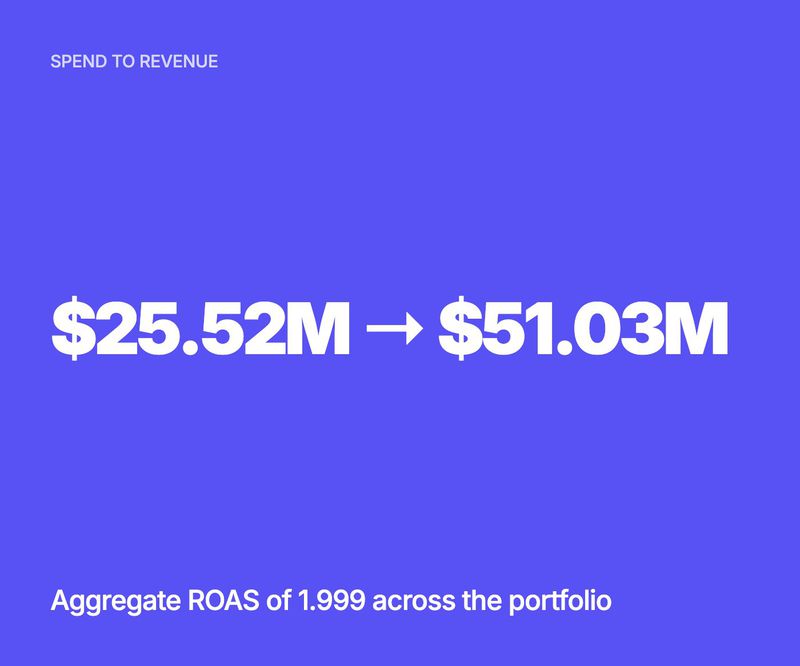
Across the data set, $25.52M in spend came with $51.03M in revenue. Search led on ROAS at 2.013, while Email had the lowest cost per acquisition at $2.439. The differences are narrow, so these rankings are hypotheses to test, not proof of cause.
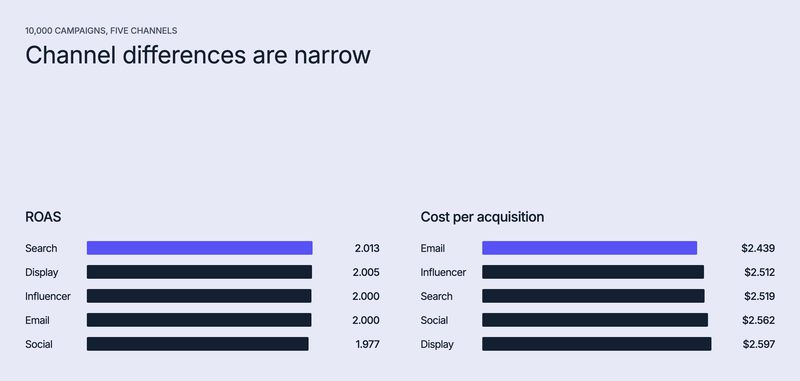
Redrawn from the project's published results.
$51.03MRevenue analysed
1.999Overall ROAS
2.013Search ROAS, the highest